
Credit Analytics Dashboard
Credit Analytics Dashboard
Credit Analytics Dashboard
Enabling faster market analysis and comparative decision-making in complex carbon credit ecosystems.
Enabling faster market analysis and comparative decision-making in complex carbon credit ecosystems.
Company
Company
Vericap
Vericap
Duration
Duration
Sep - Nov 2025
Sep - Nov 2025
My Role
My Role
Product Designer
Product Designer
About Vericap
About Vericap
Vericap is a specialized financing platform designed to bring transparency to the carbon credit ecosystem. By providing evidence-linked diligence, it transforms raw operational data into bankable assets — ensuring every credit is backed by a comprehensive, reporting-ready record.

My Role
My Role
Product Strategy
Information Architecture
Interaction Design
Interaction Design
High fidelity Design
Design System
Dashboard UX
The problem
The problem
The carbon market ecosystem is highly fragmented across registries, methodologies, project types, and geographies. Analysts and sustainability teams relied on disconnected spreadsheets, registry portals, and manual research workflows to evaluate market activity.
Despite rising crypto awareness in India, most millennial investors stick to fixed deposits and gold due to low trust, poor accessibility, and knowledge gaps which limits portfolio diversification.
The carbon market ecosystem is highly fragmented across registries, methodologies, project types, and geographies. Analysts and sustainability teams relied on disconnected spreadsheets, registry portals, and manual research workflows to evaluate market activity.
60%
60%
of interactions concentrated on filtering, sorting, and table exploration
of interactions concentrated on filtering, sorting, and table exploration
45%
45%
of active users exported datasets for external comparison
of active users exported datasets for external comparison
4+
4+
disconnected tools used by analysts for a single research workflow
disconnected tools used by analysts for a single research workflow
Primary Reasearch
Primary Reasearch
Buyer feedback
Buyer feedback
"I find it difficult to quickly identify which methodologies or regions are driving market activity."
"I find it difficult to quickly identify which methodologies or regions are driving market activity."
Analyst feedback
Analyst feedback
"I usually export the data into spreadsheets because it's easier for me to analyze trends there."
"I usually export the data into spreadsheets because it's easier for me to analyze trends there."
Analyst feedback
Analyst feedback
"I can access the data I need, but scanning through large tables feels mentally exhausting."
"I can access the data I need, but scanning through large tables feels mentally exhausting."
Key Insights
Key Insights
Spreadsheet dependency
Spreadsheet dependency
Users relied heavily on spreadsheets because the platform lacked efficient comparative analysis workflows.
Users relied heavily on spreadsheets because the platform lacked efficient comparative analysis workflows.
Cognitive overload
Cognitive overload
Dense tables and fragmented datasets significantly increased cognitive load during market exploration.
Dense tables and fragmented datasets significantly increased cognitive load during market exploration.
Insights, not raw data
Insights, not raw data
Users needed actionable trends and signals — not just access to raw carbon market data.
Users needed actionable trends and signals — not just access to raw carbon market data.
Scanability
Scanability
Faster filtering and clearer hierarchy significantly improved scanability across high-density analytics workflows.
Faster filtering and clearer hierarchy significantly improved scanability across high-density analytics workflows.
The Opportunity
The Opportunity
How might we simplify exploration of fragmented carbon market data, reduce cognitive overload, make comparative analysis faster, and surface meaningful market insights beyond raw numbers?
How might we simplify exploration of fragmented carbon market data, reduce cognitive overload, make comparative analysis faster, and surface meaningful market insights beyond raw numbers?
Simplify complex data
Clear hierarchy and structured layouts to make dense datasets easier to scan.
Clear hierarchy and structured layouts to make dense datasets easier to scan.
Surface insights faster
Help users identify market trends without relying on manual analysis.
Help users identify market trends without relying on manual analysis.
Enable deep exploration
Scalable filtering and comparison workflows for deeper market research.
Scalable filtering and comparison workflows for deeper market research.
The Solution
The Solution
01
01
KPI cards with trend indicators, mini visualizations, and YoY comparisons surface market signals at a glance — replacing raw tables with an insight-driven overview dashboard.
KPI cards with trend indicators, mini visualizations, and YoY comparisons surface market signals at a glance — replacing raw tables with an insight-driven overview dashboard.
02
02
A restructured Projects tab with summary cards, advanced multi-dimensional filters, and structured rows made project discovery and methodology comparison dramatically faster.
A restructured Projects tab with summary cards, advanced multi-dimensional filters, and structured rows made project discovery and methodology comparison dramatically faster.
03
03
The Retired Credits experience introduced retirement velocity KPIs, sector distribution charts, and a timeline view, helping users analyze demand trends without manual effort.
The Retired Credits experience introduced retirement velocity KPIs, sector distribution charts, and a timeline view, helping users analyze demand trends without manual effort.
04
04
A scalable filtering system with multi-select, searchable dropdowns, date ranges, and range sliders matched each filter type to the underlying data behavior and analyst mental model.
A scalable filtering system with multi-select, searchable dropdowns, date ranges, and range sliders matched each filter type to the underlying data behavior and analyst mental model.
A Sneak Peak
A Sneak Peak
After countless brainstorming sessions and iterations, I crafted a solution that perfectly aligns with our goals and design principles. Ready for a sneak peek? Here it is!
After countless brainstorming sessions and iterations, I crafted a solution that perfectly aligns with our goals and design principles. Ready for a sneak peek? Here it is!
Overview
Overview
Overview
To enhance discoverability and improve interpretability of major insights, I designed KPI cards show trend indicators, comparisons, and mini visualizations.
I also incorporated comparative trend analysis which enabled users to quickly understand changes across methodologies and market activity.
To enhance discoverability and improve interpretability of major insights, I designed KPI cards show trend indicators, comparisons, and mini visualizations.
I also incorporated comparative trend analysis which enabled users to quickly understand changes across methodologies and market activity.
To enhance discoverability and improve interpretability of major insights, I designed KPI cards show trend indicators, comparisons, and mini visualizations.
I also incorporated comparative trend analysis which enabled users to quickly understand changes across methodologies and market activity.
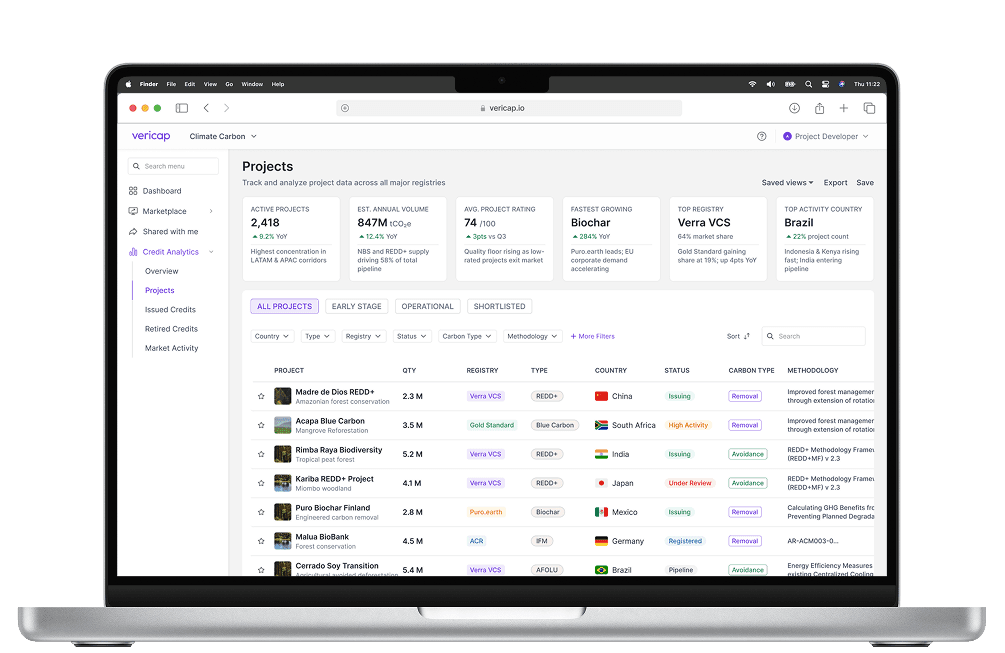
Projects
Projects
Projects
I designed summary cards to provide quick context before deeper project exploration
I also grouped related information by colour and pills in the projects tables to make rows easier to scan.
I designed summary cards to provide quick context before deeper project exploration
I also grouped related information by colour and pills in the projects tables to make rows easier to scan.
I designed summary cards to provide quick context before deeper project exploration
I also grouped related information by colour and pills in the projects tables to make rows easier to scan.
Result & Impact
Result & Impact
2 months (March - April 2026) of data after the release
2 months (March - April 2026) of data after the release
~18%
~18%
Faster market exploration
Faster market exploration
~24%
~24%
Reduction in spreadsheet exports
Reduction in spreadsheet exports
21%
21%
Faster project comparison
Faster project comparison
Read detailed case study

Let's talk!
Always open to talk about design, product & tech in general
Always open to talk about design, product & tech in general
